显示标签为“United”的博文。显示所有博文

2013年9月26日星期四

Guidelines for the Diagnosis and Management of Food Allergy in the United States: What’s in It for Patients?


Guidelines for the Diagnosis and Management of Food Allergy in the United States


Download your copy of the Guidelines Summary for Patients, Families, and Caregivers: http://www.niaid.nih.gov/topics/foodAllergy/clinical/Documents/FAguidelinesPatient.pdf.


What’s in It for Patients
What the Guidelines Summary Tells You


The Guidelines for the Diagnosis and Management of Food Allergy in the United States: Summary for Patients, Families, and Cargivers summarizes the most important information from the Guidelines and provides a starting point for patient-doctor conversations about food allergy. We hope that this information will empower patients, families, and caregivers with the knowledge they need to manage the disorder and, in turn, experience a better quality of life.


Why You Need To Know About the Food Allergy Guidelines


Approximately 1 in 20 children and about one in 25 adults have a food allergy. If you have a food allergy, then the more you know and understand about the disease and its diagnosis and management, the better you will be able to discuss your care with your doctor.


The Guidelines for the Diagnosis and Management of Food Allergy in the United States: Report of the NIAID-sponsored Expert Panel is a report developed by a 25-member expert panel to help healthcare professionals, including family practice physicians, medical specialists, and nurses, to better care for their patients with food allergy. The guidelines are based on the most up-to-date scientific and clinical information about food allergy and the consensus expert opinion of the panel members.


Make sure your doctor knows that the guidelines are available so you can work together to manage your food allergy effectively.


The Food Allergy Guidelines—What They Tell Your Doctor


The guidelines were developed for healthcare professionals. In addition to important background information about food allergy, the guidelines contain 43 clinical recommendations that can help your doctor determine whether you have food allergy and if you do, then customize your care.


The guidelines provide the following information:


•Definitions of food allergy and disorders associated with food allergy
•Descriptions of the development of food allergy and conditions associated with food allergy
•Recommendations on
â—¦How to diagnose food allergy and what tests to use
â—¦How to manage non-life-threatening allergic reactions
â—¦How to diagnose and manage potentially life-threatening food-induced anaphylaxis and other acute reactions


Digging Deeper—What’s in the Guidelines for You?
•Definitions


The guidelines define food, food allergy, food allergens, and specific allergic conditions associated with food. The guidelines also provide information to enable your doctor to distinguish food allergy from food intolerance (read about the difference between these two conditions).


•Common food allergens
In the United States, the most common food allergens are egg, milk, peanut, tree nuts, wheat, crustacean shellfish, fish, and soy.


•How food allergy develops
Food allergy is more common in children than in adults.


Most children will outgrow allergies to milk, egg, soy, and wheat. Allergies to peanut or tree nuts are often lifelong. A food allergy that starts in adulthood, such as an allergy to shellfish, also tends to be lifelong.


Food allergy often co-exists with other diseases, such as asthma, eczema (atopic dermatitis), and eosinophilic esophagitis. If your family has a history of allergy and you have eczema, then you are at greater risk for having food allergy than someone who does not have these risk factors.


Because the severity of an allergic reaction to food is based on many factors, the severity of any future reaction cannot be accurately predicted by the severity of a past reaction.


•Diagnosing food allergy and which tests are used


If you have had an adverse reaction to a food, see a doctor who can evaluate whether you have a food allergy. Although you may think that your reaction is caused by an allergic response to a food, only your doctor can determine whether this is true.


The guidelines recommend that your doctor first takes your detailed medical history and then performs a physical examination. If a diagnosis of food allergy seems likely, there are tests―such as the skin prick test or a blood test that detects allergen-specific antibodies―that will help identify the possible allergenic foods. However, these approaches cannot conclusively diagnose a food allergy.


The only test that definitively proves whether you have a food allergy is an oral food challenge. Because having this test can place you at risk for a severe allergic reaction, it must always be performed by a healthcare professional who has the appropriate experience and resources to perform this test.


Read more about tests used to diagnose food allergy.


•Ways to manage your food allergy after a diagnosis
Is there a cure for food allergy? Not yet. The only way to prevent a reaction to a food is to avoid the allergenic food.


The guidelines suggest that you read food labels carefully.


If you have a child with food allergy, the guidelines suggest seeking nutritional counseling.


Remember, because some allergies can be outgrown, you should be re-tested periodically to see whether you are still allergic.


•Anaphylaxis and foods most likely to cause it
Anaphylaxis is a serious allergic reaction that is rapid in onset and may result in death.


Anaphylaxis can have many symptoms and affect different parts of the body. As a result, it is under-recognized and under-treated. Read more about anaphylaxis and its symptoms.


The most common trigger foods for anaphylaxis are peanut, tree nuts, milk, egg, fish, and crustacean shellfish.


To reduce the risk of anaphylaxis, it is essential that you avoid your specific trigger food.


•What to do if you are experiencing anaphylaxis
What Is Anaphylaxis?
The guidelines recommend that if you are experiencing anaphylaxis, or even suspect that you are, immediately take epinephrine and seek immediate medical attention by calling 9-1-1. Delaying epinephrine use places you at significantly increased risk for a life-threatening reaction.


•Be prepared—have an emergency plan in case you experience anaphylaxis
If a doctor has told you that you have had anaphylaxis, the guidelines recommend that you and your doctor develop an anaphylaxis emergency plan so that you can be prepared in case it happens again. For example, always carry epinephrine with you in a self-injectable form.


See an example of an anaphylaxis emergency action plan (PDF) from the American Academy of Allergy, Asthma & Immunology: http://www.aaaai.org/members/resources/anaphylaxis_toolkit/action_plan.pdf.


FULL-TEXT:
What’s in It for Patients?


Food Allergy
Food Allergy


2013年9月24日星期二

Products - Data Briefs - Number 121 - May 2013: Trends in Allergic Conditions Among Children: United States, 1997–2011

Products – Data Briefs – Number 121 – May 2013


NCHS Data Brief


Number 121, May 2013


Trends in Allergic Conditions Among Children: United States, 1997–2011


PDF Version Adobe PDF file (444 KB)
Kristen D. Jackson, M.P.H.; LaJeana D. Howie, M.P.H., C.H.E.S.; Lara J. Akinbami, M.D.


Key findings


Data from the National Health Interview Survey, 1997–2011


  • The prevalence of food and skin allergies increased in children under age 18 years from 1997–2011.

  • The prevalence of skin allergies decreased with age. In contrast, the prevalence of respiratory allergies increased with age.

  • Hispanic children had a lower prevalence of food allergy, skin allergy, and respiratory allergy compared with children of other race or ethnicities. Non-Hispanic black children were more likely to have skin allergies and less likely to have respiratory allergies compared with non-Hispanic white children.

  • Food and respiratory allergy prevalence increased with income level. Children with family income equal to or greater than 200% of the poverty level had the highest prevalence rates.


Allergic conditions are among the most common medical conditions affecting children in the United States (1–5). An allergic condition is a hypersensitivity disorder in which the immune system reacts to substances in the environment that are normally considered harmless (6,7). Food or digestive allergies, skin allergies (such as eczema), and respiratory allergies (such as hay fever) are the most common allergies among children. Allergies can affect a child’s physical and emotional health and can interfere with daily activities, such as sleep, play, and attending school (8,9). A severe allergic reaction with rapid onset, anaphylaxis, can be life threatening. Foods represent the most common cause of anaphylaxis among children and adolescents (10,11). Early detection and appropriate interventions can help to decrease the negative impact of allergies on quality of life (6). This report presents recent trends in the prevalence of allergies and differences by selected sociodemographic characteristics for children under age 18 years.
Keywords: allergy, National Health Interview Survey


The prevalence of food and skin allergies increased in children aged 0–17 years from 1997–2011.


Among children aged 0–17 years, the prevalence of food allergies increased from 3.4% in 1997–1999 to 5.1% in 2009–2011. The prevalence of skin allergies increased from 7.4% in 1997–1999 to 12.5% in 2009–2011. There was no significant trend in respiratory allergies from 1997–1999 to 2009–2011, yet respiratory allergy remained the most common type of allergy among children throughout this period (17.0% in 2009–2011). Skin allergy prevalence was also higher than food allergy prevalence for each period from 1997–2011 (Figure 1).


Figure 1. Percentage of children aged 0–17 years with a reported allergic condition in the past 12 months: United States, 1997–2011

Figure 1 is a line graph showing the percentage of children aged 0–17 years with a reported allergic condition in the past 12 months for 1997–2011.


1Significant increasing linear trend for food and skin allergy from 1997–1999 to 2009–2011.
SOURCE: CDC/NCHS, Health Data Interactive, National Health Interview Survey.


Younger children were more likely to have skin allergies, while older children were more likely to have respiratory allergies.


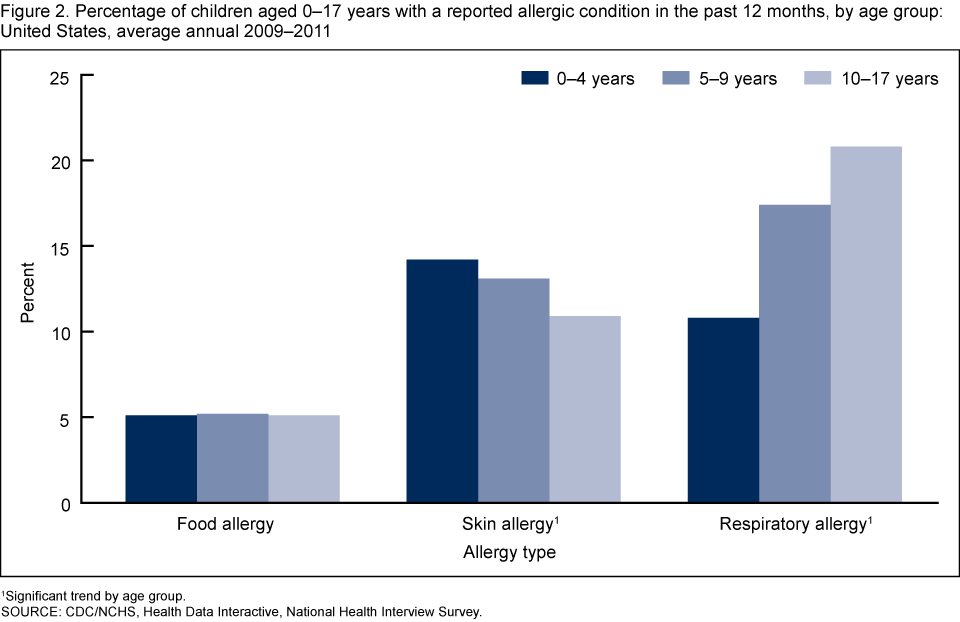
Food allergy prevalence was similar among all age groups. Skin allergy prevalence decreased with the increase of age (14.2% among 0–4 years, 13.1% among 5–9 years, and 10.9% among 10–17 years); while respiratory allergy prevalence increased with the increase of age (10.8% among 0–4 years, 17.4% among 5–9 years, and 20.8% among 10–17 years) (Figure 2).


Figure 2. Percentage of children aged 0–17 years with a reported allergic condition in the past 12 months, by age group: United States, average annual 2009–2011

Figure 2 is a bar chart showing the percentage of children aged 0–17 years with a reported allergic condition in the past 12 months by age for combined years 2009–2011.


1Significant trend by age group.
SOURCE: CDC/NCHS, Health Data Interactive, National Health Interview Survey.


Hispanic children had lower rates of all three types of allergies compared with children of other race or ethnicities. Non-Hispanic black children were more likely to have skin allergies and less likely to have respiratory allergies compared with non-Hispanic white children.


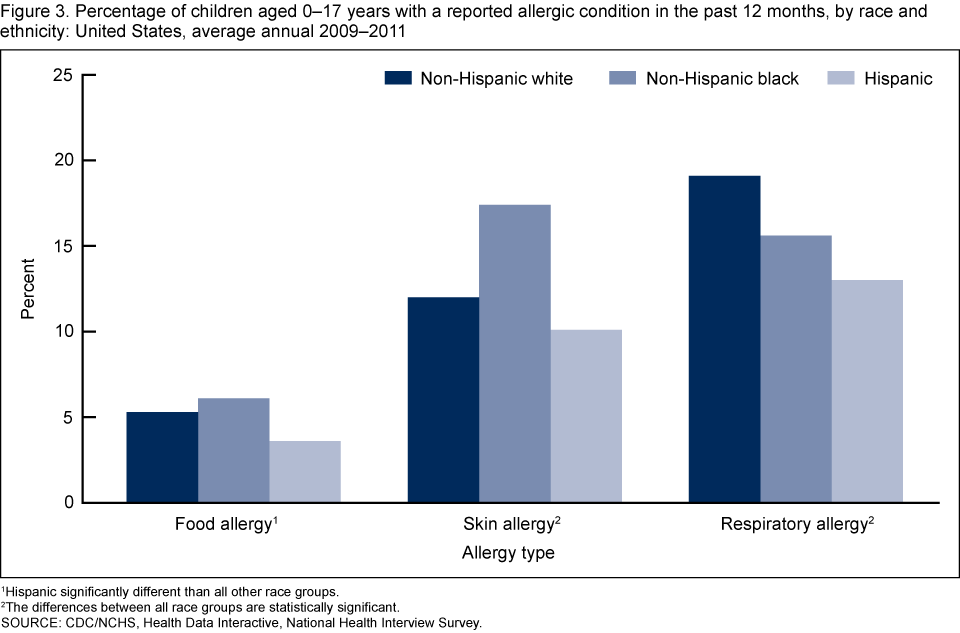
Hispanic children had a lower prevalence of food allergy (3.6%), skin allergy (10.1%), and respiratory allergy (13.0%) compared with non-Hispanic white and non-Hispanic black children. Non-Hispanic black children had a higher percentage of reported skin allergy (17.4%) compared with non-Hispanic white children (12.0%) and a lower percentage of respiratory allergy (15.6%) compared with non-Hispanic white children (19.1%) (Figure 3).


Figure 3. Percentage of children aged 0–17 years with a reported allergic condition in the past 12 months, by race and ethnicity: United States, average annual 2009–2011

Figure 3 is bar chart showing the percentage of children aged 0–17 years with a reported allergic condition in the past 12 months by race and ethnicity for combined years 2009–2011.


1Hispanic significantly different than all other race groups.
2The differences between all race groups are statistically significant.
SOURCE: CDC/NCHS, Health Data Interactive, National Health Interview Survey.


The prevalence of food and respiratory allergy, but not skin allergy, increased with higher income levels.


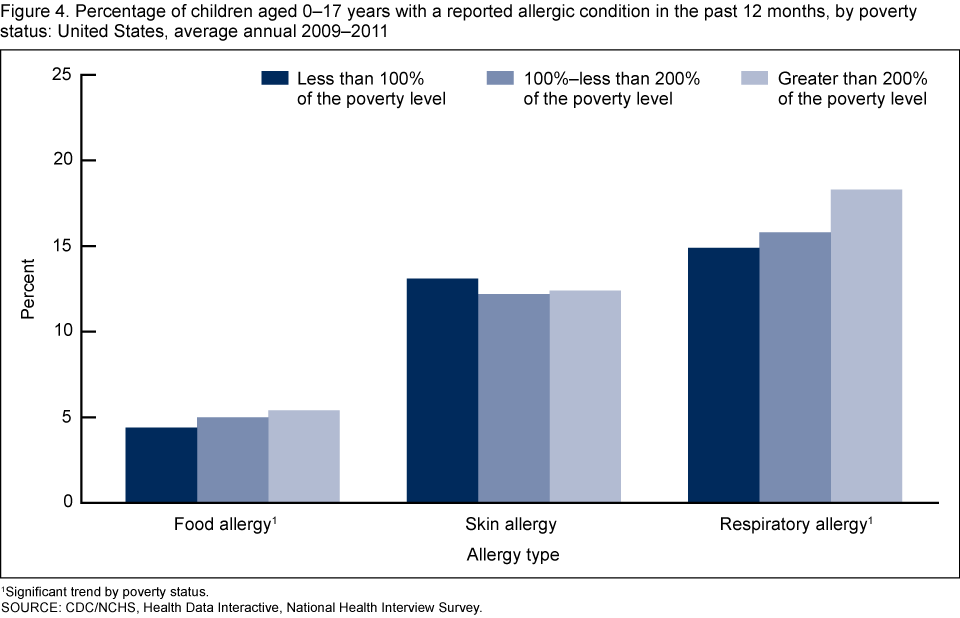
The prevalence of both food allergy and respiratory allergy increased with the increase of income level. Among children with family income less than 100% of the poverty level, 4.4% had a food allergy and 14.9% had a respiratory allergy. Food allergy prevalence among children with family income between 100% and 200% of the poverty level was 5.0%, and respiratory allergy prevalence was 15.8%. Among children with family income above 200% of the poverty level, food allergy prevalence was 5.4%, and respiratory allergy prevalence was 18.3%. There was no significant difference in the prevalence of skin allergy by poverty status (Figure 4).


Figure 4. Percentage of children aged 0–17 years with a reported allergic condition in the past 12 months, by poverty status: United States, average annual 2009–2011

Figure 4 is a bar chart showing the percentage of children aged 0–17 years with a reported allergic condition in the past 12 months by poverty status for combined years 2009–2011.


1Significant trend by poverty status.
SOURCE: CDC/NCHS, Health Data Interactive, National Health Interview Survey.


Summary


Among children under age 18 years in the United States, the prevalence of food and skin allergies increased from 1997–1999 to 2009–2011. The prevalence of respiratory allergy, which is the most prevalent type of allergy among children, did not change during this period. There was no significant difference in food allergy prevalence between age groups. However, skin allergy decreased with the increase of age, and respiratory allergy increased with the increase of age. The prevalence of allergies varies by race and ethnicity, with Hispanic children having the lowest prevalence of food, skin, and respiratory allergies compared with non-Hispanic white and non-Hispanic black children. Non-Hispanic black children were more likely to have skin allergies and less likely to have respiratory allergies compared with non-Hispanic white children. The prevalence of allergies differed by poverty status. Food allergy and respiratory allergy increased with the increase of income level, but there was no difference in the prevalence of skin allergy by poverty status.


Definitions


Respiratory allergy prevalence: Estimated based on affirmative responses to either of the two National Health Interview Survey (NHIS) question(s): “During the past 12 months, has your child had hay fever?” and “During the past 12 months, has your child had any kind of respiratory allergy?”
Food allergy prevalence: Estimated based on an affirmative response to the NHIS question: “During the past 12 months, has your child had any kind of food or digestive allergy?”
Skin allergy prevalence: Estimated based on an affirmative response to the NHIS question: “During the past 12 months, has your child had eczema or any kind of skin allergy?”
Poverty status: Based on family income, family size, and the number of children in the family; and for families with two or fewer adults, on the age of the adults in the family. The poverty level is based on a set of income thresholds that vary by family size and composition. Families or individuals with income below their appropriate thresholds are classified as below the poverty level. These thresholds are updated annually by the U.S. Census Bureau to reflect changes in the Consumer Price Index for all urban consumers (12). Estimates by poverty status from NHIS are based on both reported and imputed family income (13).


Data source and methods


Prevalence estimates for allergic conditions were obtained from the Health Data Interactive (HDI) table, “Allergic conditions, ages 0–17: U.S., 1997–2011,” available from the Health Data Interactive website. NHIS data were used to estimate the prevalence of allergic conditions for this HDI table.
NHIS data are collected continuously throughout the year for the Centers for Disease Control and Prevention’s National Center for Health Statistics by interviewers from the U.S. Census Bureau. NHIS collects information about the health and the health care of the civilian noninstitutionalized U.S. population. Interviews are conducted in respondents’ homes, but follow-ups to complete the interviews may be conducted over the telephone. The Sample Child component collects detailed data on health conditions for a randomly selected child in households with at least one child. All of the data in the Sample Child component are obtained from a proxy respondent and not from medical records. A responsible adult, usually a parent, responds to the survey questions as proxy for the sample child. For further information about NHIS and the questionnaire, visit the NHIS website.
NHIS is designed to yield a sample that is representative of the civilian noninstitutionalized population of the United States, and the survey uses weighting to produce national estimates. Data weighting procedures are described in more detail elsewhere (14). Point estimates and estimates of corresponding variances for the HDI estimates were calculated using SUDAAN software (15) to account for the complex sample design of NHIS. The Taylor series linearization method was chosen for variance estimation.
Differences between percentages were evaluated using two-sided significance tests at the 0.05 level. Terms such as “higher” and “lower” indicate statistically significant differences. Terms such as “no difference” indicate that the statistics being compared were not significantly different. Lack of comment regarding the difference between any two statistics does not necessarily suggest that the difference was tested and found to be not significant. All estimates shown in this report have a relative standard error less than or equal to 30%. The significance of trends was tested using weighted least squares regression models of the log of each outcome and Joinpoint software (16) to determine whether an apparent change over time was statistically significant, taking into account the standard error for each data point. Because there were limited data points over the period, linear regression (zero joinpoints) was specified for all models.


About the author


Kristen D. Jackson, LaJeana D. Howie, and Lara J. Akinbami are with the Centers for Disease Control and Prevention’s National Center for Health Statistics, Office of Analysis and Epidemiology.


References


  1. Friedman AH, Morris TL. Allergies and anxiety in children and adolescents: A review of the literature. J Clin Psychol Med Settings 13(3):318–31. 2006.


  2. Gupta RS, Springston EE, Smith B, Kim JS, Pongracic JA, Wang X, Holl J. Food allergy knowledge, attitudes, and beliefs of parents with food-allergic children in the United States. Pediatr Allergy Immunol 21(6):927–34. 2010.


  3. Vassallo MF, Banerji A, Rudders SA, Clark S, Mullins RJ, Camargo CA Jr. Season of birth and food allergy in children. Ann Allergy Asthma Immunol 104(4):307–13. 2010.


  4. Akinbami LJ, Moorman JE, Garbe PL, Sondik EJ. Status of childhood asthma in the United States, 1980–2007. Pediatrics 123 Suppl 3:S131–45. 2009.


  5. Mailhol C, Lauwers-Cances V, Rancé F, Paul C, Giordano-Labadie F. Prevalence and risk factors for allergic contact dermatitis to topical treatment in atopic dermatitis: A study in 641 children. Allergy 64(5):801–6. 2009.


  6. Stone KD. Atopic diseases of childhood. Curr Opin Pediatr 14(5):634–46. 2002.


  7. Muraro A, Roberts G, Clark A, Eigenmann PA, Halken S, Lack G. The management of anaphylaxis in childhood: Position paper of the European Academy of Allergology and Clinical Immunology. Allergy 62(8):857–71. 2007.


  8. Baiardini I, Braido F, Brandi S, Canonica GW. Allergic diseases and their impact on quality of life. Ann Allergy Asthma Immunol 97(4):419–28. 2006.


  9. Marklund B, Ahlstedt S, Nordstrom G. Health-related quality of life among adolescents with allergy-like conditions—with emphasis on food hypersensitivity. Health Qual Life Outcomes 2:65. 2004.


  10. De Silva IL, Mehr SS, Tey D, Tang ML. Paediatric anaphylaxis: A 5 year retrospective review. Allergy 63(8):1071–6. 2008.


  11. Lee JK, Vadas P. Anaphylaxis: Mechanisms and management. Clin Exp Allergy 41(7):923–38. 2011.


  12. U.S. Census Bureau. PovertyExternal Web Site Icon. 2012.


  13. Schenker N, Raghunathan TE, Chiu PL, et al. Multiple imputation of family income and personal earnings in the National Health Interview Survey: Methods and examples. Hyattsville, MD: National Center for Health Statistics. 2010.


  14. Botman SL, Moore TF, Moriarity CL, Parsons VL. Design and estimation for the National Health Interview Survey, 1995–2004. National Center for Health Statistics. Vital Health Stat 2(130). 2000.


  15. SUDAAN, release 9.1 [computer software]. Research Triangle Park, NC: RTI International. 2004.


  16. Joinpoint Regression Program, version 3.4 [computer software]. Bethesda, MD: National Institutes of Health, National Cancer Institute. 2010.


Suggested citation


Jackson KD, Howie LD, Akinbami LJ. Trends in allergic conditions among children: United States, 1997–2011. NCHS data brief, no 121. Hyattsville, MD: National Center for Health Statistics. 2013.


Copyright information


All material appearing in this report is in the public domain and may be reproduced or copied without permission; citation as to source, however, is appreciated.


National Center for Health Statistics


Charles J. Rothwell, M.S. Acting Director
Jennifer H. Madans, Ph.D., Associate Director for Science


Office of Analysis and Epidemology

Irma E. Arispe, Ph.D., Director


2013年9月19日星期四

QuickStats: Percentage of Adults Aged ≥18 Years Who Were Current Smokers,* by White or Black Race and Hispanic Subpopulation† — National Health Interview Survey, United States, 2010§

QuickStats: Percentage of Adults Aged ≥18 Years Who Were Current Smokers,* by White or Black Race and Hispanic Subpopulation† — National Health Interview Survey, United States, 2010§


QuickStats: Percentage of Adults Aged ≥18 Years Who Were Current Smokers,* by White or Black Race and Hispanic Subpopulation† — National Health Interview Survey, United States, 2010§


Weekly


The figure shows the percentage of adults aged ≥18 years who were current smokers, by white or black race and Hispanic subpopulation, in the United States during 2010, according to the National Health Interview Survey. Overall, 12.2% of Hispanic adults were current cigarette smokers, compared with 21.7% of non-Hispanic white adults and 19.8% of non-Hispanic black adults. Among five Hispanic subpopulations, Central or South American adults (7.2%) were less likely to be current smokers compared with Mexican adults (12.0%), Puerto Rican adults (16.9%), Cuban adults (14.5%) and other Hispanic adults (17.7%).


* Current smokers have smoked at least 100 cigarettes in their lifetime and currently smoke cigarettes. Unknowns were not included in the denominators when calculating percentages.


† All whites and blacks were non-Hispanic. Persons of Hispanic ethnicity might be of any race or combination of races.


§ Estimates are based on household interviews of a sample of the U.S. civilian, noninstitutionalized population. Estimates are age-adjusted using the projected 2000 U.S. population as the standard population and using four age groups: 18–44 years, 45–64 years, 65–74 years, and ≥75 years.


¶ 95% confidence interval.

Overall, 12.2% of Hispanic adults were current cigarette smokers, compared with 21.7% of non-Hispanic white adults and 19.8% of non-Hispanic black adults. Among five Hispanic subpopulations, Central or South American adults (7.2%) were less likely to be current smokers compared with Mexican adults (12.0%), Puerto Rican adults (16.9%), Cuban adults (14.5%), and other Hispanic adults (17.7%).


Source: National Health Interview Survey, 2010 data. Available at http://www.cdc.gov/nchs/nhis.htm.

Reported by: Gulnur Freeman, MPA, gfreeman1@cdc.gov, 301-458-4085; Patricia F. Adams.

Alternate Text: The figure above shows the percentage of adults aged ≥18 years who were current smokers, by white or black race and Hispanic subpopulation, in the United States during 2010, according to the National Health Interview Survey. Overall, 12.2% of Hispanic adults were current cigarette smokers, compared with 21.7% of non-Hispanic white adults and 19.8% of non-Hispanic black adults. Among five Hispanic subpopulations, Central or South American adults (7.2%) were less likely to be current smokers compared with Mexican adults (12.0%), Puerto Rican adults (16.9%), Cuban adults (14.5%) and other Hispanic adults (17.7%).


March 30, 2012 / 61(12);215

2013年9月14日星期六

QuickStats: Percentage of Noninstitutionalized Adults Aged ≥80 Years Who Need Help with Personal Care,* by Sex --- United States, 2008--2009


QuickStats: Percentage of Noninstitutionalized Adults Aged ≥80 Years Who Need Help with Personal Care,* by Sex — United States, 2008–2009
Weekly
June 24, 2011 / 60(24);819


The figure shows the percentage of noninstitutionalized adults aged ≥80 years who need help with personal care, by sex, in the United States during 2008-2009. Among noninstitutionalized adults aged ≥80 years, women were more likely than men to need the help of another person with personal-care activities (14.8% versus 10.2%). In particular, women were more likely than men to need help when bathing or showering (12.1% versus 8.1%), dressing (9.1% versus 7.0%), and eating (3.9% versus 2.4%).


* Estimates are based on household interviews of a sample of the civilian, noninstitutionalized U.S. population aged ≥80 years. Adults living in long-term care institutions (e.g., assisted living facilities, nursing homes for the elderly, or hospitals for the chronically ill or the physically or intellectually disabled) or correctional facilities are excluded from the sample. Data on personal-care activities are based on responses to the question, ‘Because of a physical, mental, or emotional problem, [do you/does anyone in the family] need the help of other persons with personal care needs, such as eating, bathing, dressing, or getting around inside the home?’ Respondents who answered affirmatively were then asked, in separate questions, if the person in question needed help with 1) bathing or showering; 2) dressing; 3) eating; 4) getting in or out of bed or chairs; 5) using the toilet, including getting to the toilet; or 6) getting around inside the home. Persons with unknown information regarding personal-care activities were excluded from the denominators.


† 95% confidence interval.


Among noninstitutionalized adults aged ≥80 years, women were more likely than men to need the help of another person with personal-care activities (14.8% versus 10.2%). In particular, women were more likely than men to need help when bathing or showering (12.1% versus 8.1%), dressing (9.1% versus 7.0%), and eating (3.9% versus 2.4%).


Source: National Health Interview Survey, 2008–2009. Available at http://www.cdc.gov/nchs/nhis.htm.


Alternate Text: The figure above shows the percentage of noninstitutionalized adults aged ≥80 years who need help with personal care, by sex, in the United States during 2008-2009. Among noninstitutionalized adults aged ≥80 years, women were more likely than men to need the help of another person with personal-care activities (14.8% versus 10.2%). In particular, women were more likely than men to need help when bathing or showering (12.1% versus 8.1%), dressing (9.1% versus 7.0%), and eating (3.9% versus 2.4%).


QuickStats: Percentage of Noninstitutionalized Adults Aged ≥80 Years Who Need Help with Personal Care,* by Sex — United States, 2008–2009
– Enviado mediante la barra Google”